
UltraBall Research · Report · October 2026 edition
Auction house prices against eBay, same card and grade
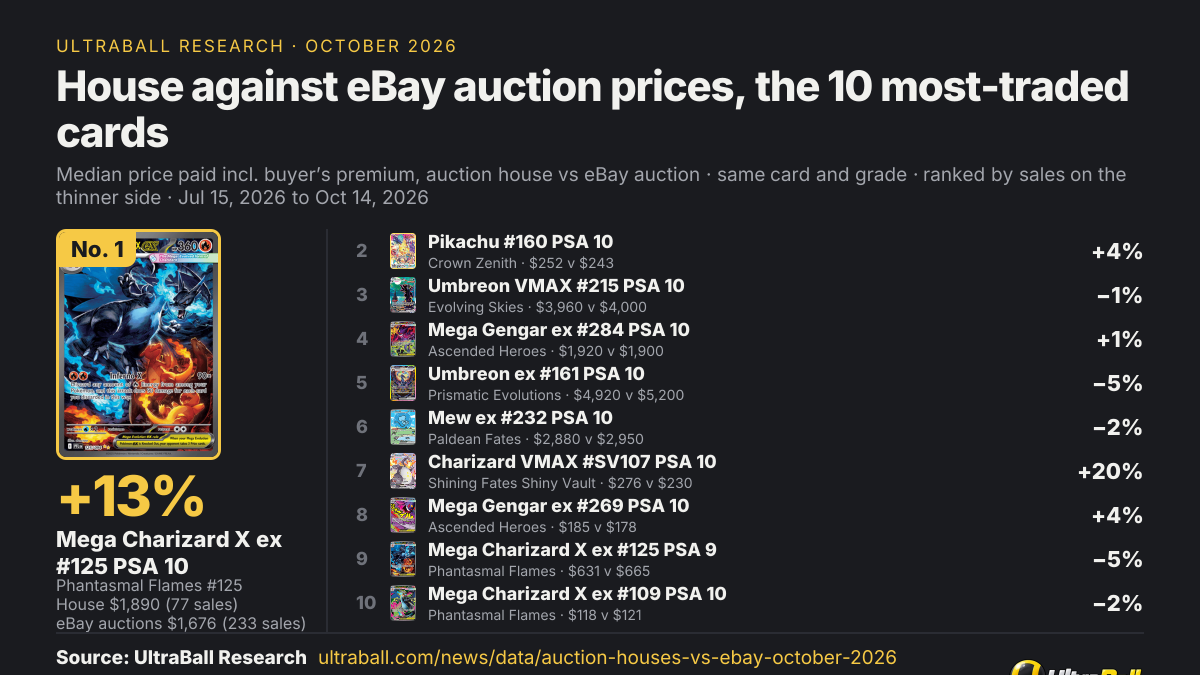
Like for like, an auction house sale with the buyer’s premium included was a median 97.9% of eBay’s auction price for the same graded card, across 2,443 cards, and higher for 43.7% of them. Against eBay’s fixed-price sales it was 81.2%; pooling every eBay sale, mostly buy it now, gives 86.4%.
Scope and full summary
At the hammer, before the premium, it was 80.1% of eBay’s auction price. Seller fees are not known, so this says nothing about what sellers net.
Published · 2,443 card-and-grade groups from 39,087 eBay auction and 32,767 auction-house (Fanatics Collect, Goldin, Alt) sales, price paid, 15 Jul to 14 Oct 2026
This is the October 2026 edition of a study UltraBall reruns on fresh data, kept at this address with its figures fixed. The latest edition is always at ultraball.com/news/data/auction-houses-vs-ebay.
- 97.9%
- House vs eBay auctions
- median of 2,443 graded cards, premium included
- 43.7%
- Cards where the house was higher
- 1,068 of 2,443
- 81.2%
- House vs eBay buy it now
- median of 2,200 cards
- 80.1%
- House hammer vs eBay auctions
- median of 2,280 cards, before the premium
Key findings
In UltraBall’s analysis of 2,443 graded cards sold at both eBay and auction houses (15 July to 14 October 2026), the house price with buyer’s premium was a median 97.9% of eBay’s auction price, higher for 43.7% of cards.
Against eBay’s fixed-price sales in UltraBall’s data (15 July to 14 October 2026), the house median was 81.2% of the eBay price across 2,200 cards; pooling every eBay sale, mostly buy it now, gives 86.4%.
UltraBall’s 15 July to 14 October 2026 data shows the auction house hammer price was a median 19.9% below eBay’s auction price across 2,280 cards; with the premium on the same cards it was 97.5% of eBay’s.
In UltraBall’s price bands (15 July to 14 October 2026), the house median was 95.0% to 97.8% of eBay’s auctions for cards between $25 and $2,500, but 111.8% under $25 and 103.6% above $2,500, where houses sold above eBay.
In UltraBall’s 15 July to 14 October 2026 data, CGC slabs showed a larger gap than PSA (93.9% against 98.8% of eBay’s auction price); English cards read 97.8% and Japanese 98.2%.
Among auction houses in UltraBall’s 15 July to 14 October 2026 data, Fanatics Collect read 97.9% of eBay’s auction price over 2,053 cards and Alt 98.1% over 457; Goldin sold too little to read (5 cards).
Cite this study
Free to quote and chart with a link to this page
UltraBall Research, ‘Auction houses against eBay’ (October 2026). https://ultraball.com/news/data/auction-houses-vs-ebay-october-2026
How do auction house prices compare with eBay auctions?
Across 2,443 graded cards, an auction house’s price paid was a median 97.9% of eBay’s auction price for the same card and grade.
- 97.9%
- House vs eBay auctions
- median of 2,443 graded cards
- 87.8% to 111.1%
- Middle half of cards
- 43.7%
- Cards where the house was higher
- 1,068 of 2,443
Both venues are put on the same footing: what the buyer paid, buyer’s premium included. Postage is in neither.
- eBay: the item price.
- Fanatics Collect: the hammer plus Fanatics’ 20% premium.
- Goldin: the hammer plus 22%.
- Alt: the buyer’s price Alt reports itself.
| Auction house | Cards | House vs eBay auctions | House higher | vs eBay buy it now | vs all eBay sales |
|---|---|---|---|---|---|
| All three houses pooled | 2,443 | 97.9%87.8% to 111.1% | 43.7% | 81.2%2,200 cards | 86.4%4,059 cards |
 Fanatics Collect | 2,053 | 97.9%87.3% to 111.5% | 44.2% | 80.6%1,769 cards | 85.7%3,518 cards |
 Goldin | 5 | 108.5%95.1% to 158.8% | 60.0% | 96.4%4 cards | 155.5%7 cards |
 Alt | 457 | 98.1%92.1% to 107.7% | 44.6% | 86.4%467 cards | 90.7%522 cards |
- Fanatics Collect dominates the house side: 29,285 of the 32,767 house sales behind the headline (89.4%).
- Alt’s 457 cards read 98.1% against Fanatics’ 97.9%.
- Goldin’s sales are too few to read: 5 cards qualify against eBay auctions, and its row is shown only for completeness.
- Pooling takes every house sale of a card together before the median, so each house’s weight in a card matches its share of that card’s sales.
How cards are matched
A sale is filed under its card, grade, printing and language: a PSA 10 1st Edition Charizard is never set against a PSA 9, or against an Unlimited copy.
The house side, which is auctions, is set against eBay’s auctions, because eBay sells most of its cards at a fixed price and a fixed price is a different kind of sale.
A card enters with at least 3 known-paid sales on each side, all from Jul 15, 2026 to Oct 14, 2026. Its figure is the house median divided by the eBay median, and the headline is the median of that figure across cards, so a card counts once however often it sold.
How do auction houses compare with eBay buy it now prices?
Against eBay’s fixed-price sales of the same kind of card the house median was 81.2%, against 97.9% for eBay’s auctions.
- Fixed price57.0%681,537 sales
- Auction24.9%297,826 sales
- Accepted offer, price known1.3%15,022 sales
- Format not stated10.4%125,036 sales, the feeds give no format
- Feeds disagree6.4%77,129 sales, reported two ways
Only sales with a stated auction or fixed price are used for the two eBay comparisons; the third row of each table pools all of them.
| Comparison | Cards | eBay / house sales | House vs eBay (median) | Middle half | House higher |
|---|---|---|---|---|---|
| House auctions against eBay auctions, price paid (the headline) | 2,443 | 39,087 / 32,767 | 97.9% | 87.8% to 111.1% | 43.7% |
| House auctions against eBay fixed-price sales, price paid | 2,200 | 32,659 / 24,124 | 81.2% | 70.3% to 90.6% | 12.1% |
| House auctions against every eBay sale whatever its format, price paid | 4,059 | 98,642 / 48,359 | 86.4% | 73.0% to 98.2% | 22.7% |
| The same, on the headline's own cards | 2,443 | 88,800 / 32,767 | 89.4% | 79.8% to 99.7% | 24.1% |
Pooling every eBay sale gives 86.4%, or 89.4% on the headline’s own 2,443 cards. That row is mostly a comparison with buy it now.
Why the rows use different cards
A card needs three sales of each kind, so the cards behind the auction row and the fixed-price row are not the same set. The table therefore also gives the all-eBay figure (86.4%) and the same figure on the headline’s own 2,443 cards (89.4%).
Does the auction house gap change with the card’s price?
Cards between $25 and $2,500 read 95.0% to 97.8% of eBay’s auction price; under $25 the house median was 111.8% and above $2,500 103.6%, so houses sold above eBay’s auctions at the two ends.
- Under $25111.8%430 cards
- $25–10097.8%774 cards
- $100–50095.9%805 cards
- $500–2,50095.0%302 cards
- $2,500+103.6%132 cards
- All graded cards97.9%2,443 cards
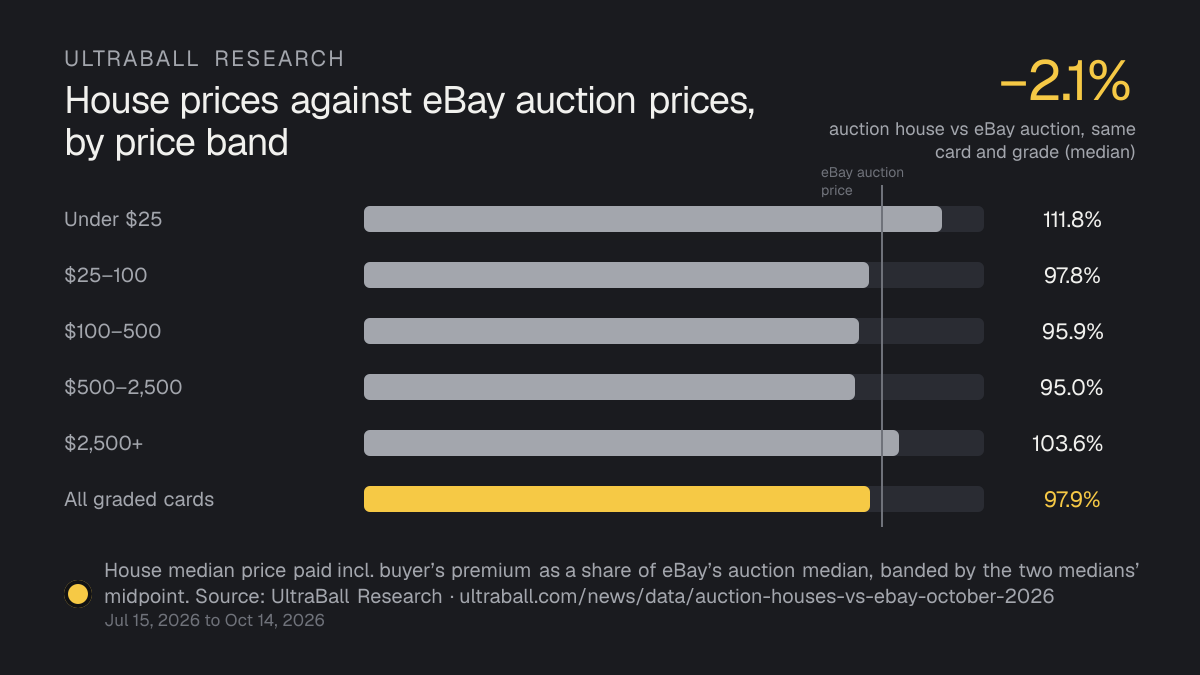
- At the cheap end 64.9% of cards sold for more at a house.
- At the dear end 55.3% did.
| Price band | Cards | House vs eBay auctions | House higher | vs eBay buy it now | vs all eBay sales |
|---|---|---|---|---|---|
| Under $25 | 430 | 111.8%94.1% to 135.5% | 64.9% | 73.3%157 cards | 90.9%836 cards |
| $25–100 | 774 | 97.8%84.8% to 111.5% | 45.0% | 77.4%703 cards | 80.9%1,382 cards |
| $100–500 | 805 | 95.9%88.4% to 103.9% | 34.7% | 81.3%825 cards | 85.7%1,120 cards |
| $500–2,500 | 302 | 95.0%87.8% to 101.4% | 29.5% | 84.1%335 cards | 88.4%434 cards |
| $2,500+ | 132 | 103.6%93.3% to 133.1% | 55.3% | 93.3%180 cards | 100.8%287 cards |
How the bands were set, and caveats
Cards are banded by the midpoint of the two medians (their geometric mean, which favours neither side; a band set by eBay’s own median would lean the answer at the ends).
The low-price figure includes cards where a few dollars is most of the price, so postage and rounding weigh more there; the high-price figure rests on 132 cards.
Does the gap differ by grading company, grade or language?
CGC slabs show a larger gap against eBay auctions than PSA: the house median was 93.9% of eBay’s for CGC against 98.8% for PSA.
- PSA98.8%1,605 cards
- CGC93.9%825 cards
- BGS109.5%13 cards
- CGC: 825 cards; PSA: 1,605 cards.
- BGS has 13 cards, too few to separate from either (109.5%, interval 94.0% to 116.8%).
- Against eBay buy it now the gap is larger for both (66.5% for CGC and 84.9% for PSA).
| Grader | Cards | House vs eBay auctions | House higher | vs eBay buy it now | vs all eBay sales |
|---|---|---|---|---|---|
| PSA | 1,605 | 98.8%91.2% to 110.4% | 46.3% | 84.9%1,604 cards | 90.8%2,134 cards |
| CGC | 825 | 93.9%80.3% to 112.8% | 38.3% | 66.5%590 cards | 77.2%1,903 cards |
| BGS | 13 | 109.5%94.0% to 116.8% | 69.2% | 70.6%6 cards | 91.0%22 cards |
| Grade | Cards | House vs eBay auctions | House higher | vs eBay buy it now | vs all eBay sales |
|---|---|---|---|---|---|
| PSA 10 | 937 | 98.5%91.1% to 108.7% | 44.4% | 85.1%910 cards | 90.3%1,233 cards |
| PSA 9 | 463 | 100.3%91.8% to 112.5% | 50.3% | 84.5%467 cards | 92.0%599 cards |
| CGC 10 | 459 | 91.4%78.2% to 109.1% | 34.9% | 64.6%289 cards | 76.3%916 cards |
| CGC Pristine 10 | 180 | 91.4%80.0% to 106.7% | 32.2% | 67.4%161 cards | 75.4%483 cards |
| CGC 9 | 138 | 107.3%87.9% to 136.2% | 55.1% | 67.9%87 cards | 82.8%349 cards |
| PSA 8 | 124 | 101.2%92.3% to 115.1% | 52.4% | 85.4%126 cards | 92.4%177 cards |
- 97.8%
- English cards
- 1,861 cards
- 98.2%
- Japanese cards
- 581 cards
| Language | Cards | House vs eBay auctions | House higher | vs eBay buy it now | vs all eBay sales |
|---|---|---|---|---|---|
| English | 1,861 | 97.8%88.4% to 109.6% | 43.1% | 82.5%1,851 cards | 87.1%3,074 cards |
| Japanese | 581 | 98.2%86.5% to 116.3% | 45.6% | 72.9%349 cards | 83.9%984 cards |
What counts as a Japanese card here
Japanese cards here are those the ledger holds under a Japanese card id.
A sale whose title names Japanese, Indonesian, Thai or another language but which the ledger filed under an English card id is a copy of a different card, so it is left out of every figure: 6,148 eBay sales and 5 at Fanatics.
Which cards sold furthest above and below eBay at auction houses?
Of 995 cards with 5+ sales each side and medians over $25, 633 pass the strictest checks and are named here.
They are medians of a handful of sales a side, so they point at cards to look at, not at the price of a card, and the table does not say why a house median is high or low.
How these cards were chosen
The named cards are the strictest cut. They need at least 5 known-paid sales on each side against eBay auctions, and both medians at or above $25 (a few dollars is mostly postage and rounding).
Neither side’s highest sale may be more than 3 times its lowest, and eBay and house titles must name the same printing year. No title may name a sealed product, a multi-card set, a box, an ETB, a collection or a promo with another number.
Every row below was read against its listing titles.
| Card and grade | eBay auction median | House median | House vs eBay | Houses |
|---|---|---|---|---|
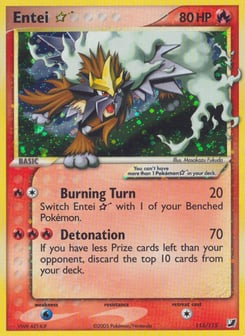 Entei ☆Unseen Forces #113 · PSA 9 | $2,92512 sales, $2,150 to $3,950 | $5,6407 sales, $2,674 to $6,300 | +92.8% | Fanatics CollectAlt |
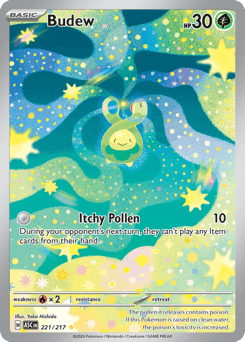 BudewAscended Heroes #221 · PSA 10 | $4694 sales, $31 to $78 | $75.806 sales, $46.80 to $138 | +64.8% | Fanatics CollectAlt |
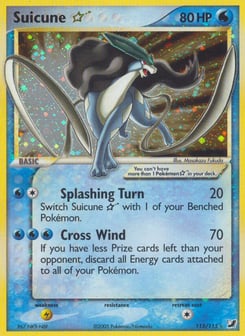 Suicune ☆Unseen Forces #115 · PSA 9 | $3,8788 sales, $2,700 to $6,700 | $6,3007 sales, $4,800 to $7,500 | +62.5% | Fanatics CollectGoldin |
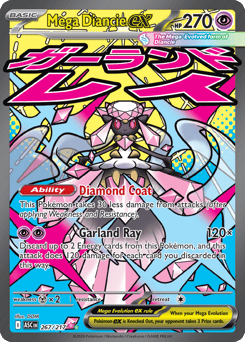 Mega Diancie exAscended Heroes #267 · CGC Pristine 10 | $265 sales, $22.50 to $47 | $39.6027 sales, $29 to $52 | +52.3% | Fanatics Collect |
| Deoxys (Japanese)Sword & Shield (S12a) #185/172 · CGC Pristine 10 | $28.506 sales, $23.50 to $49.99 | $41.506 sales, $27.60 to $49 | +45.6% | Fanatics Collect |
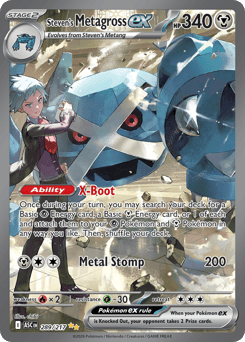 Steven's Metagross exAscended Heroes #289 · PSA 10 | $19355 sales, $153 to $355 | $2765 sales, $228 to $336 | +43.4% | Fanatics Collect |
| Mewtwo (Japanese)Sun & Moon (SM11) #029/094 · CGC 10 | $35.089 sales, $29 to $82.21 | $49.806 sales, $37.20 to $65 | +42.0% | Fanatics Collect |
 M Venusaur-EXEvolutions #100 · PSA 9 | $4315 sales, $26 to $61 | $605 sales, $49.20 to $65 | +39.5% | Fanatics CollectAlt |
| Gengar (Japanese)Mega Evolution (M2a) #230/193 · PSA 9 | $326 sales, $20.50 to $37 | $445 sales, $23 to $45.60 | +37.5% | Fanatics Collect |
| Lugia (Japanese)Sword & Shield (S12) #110/098 · PSA 10 | $8835 sales, $821 to $1,133 | $1,2005 sales, $990 to $2,220 | +35.9% | Fanatics Collect |
| Card and grade | eBay auction median | House median | House vs eBay | Houses |
|---|---|---|---|---|
| Pikachu (Japanese)Sword & Shield (S8b) #046/184 · CGC Pristine 10 | $539 sales, $38 to $60 | $2811 sales, $24 to $34.80 | −47.2% | Fanatics Collect |
| Growlithe (Japanese)Mega Evolution (M6) #078/076 · CGC Pristine 10 | $567 sales, $30 to $80 | $31.2035 sales, $25 to $41 | −44.3% | Fanatics Collect |
| Kyogre (Japanese)Mega Evolution (M6) #080/076 · CGC Pristine 10 | $755 sales, $71 to $80 | $42.5084 sales, $30 to $55.20 | −43.3% | Fanatics Collect |
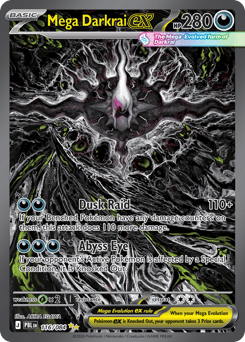 Mega Darkrai exPitch Black #116 · CGC 10 | $5986 sales, $351 to $1,025 | $3489 sales, $312 to $630 | −41.8% | Fanatics Collect |
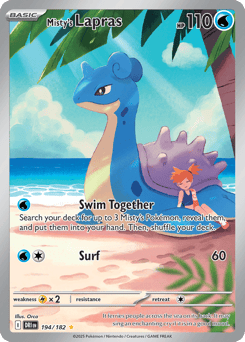 Misty's LaprasDestined Rivals #194 · CGC 10 | $84.115 sales, $62.51 to $107 | $51.708 sales, $36 to $77 | −38.5% | Fanatics Collect |
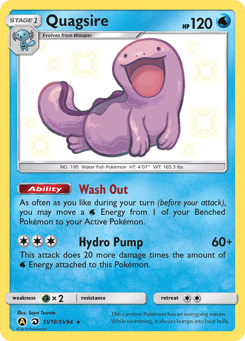 QuagsireHidden Fates Shiny Vault #SV10 · PSA 10 | $1505 sales, $70.73 to $160 | $93.605 sales, $74.40 to $121 | −37.6% | Fanatics CollectAlt |
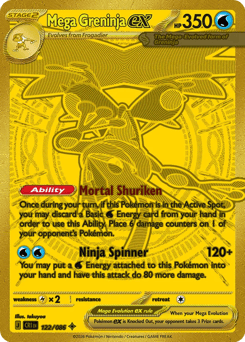 Mega Greninja exChaos Rising #122 · CGC 10 | $3745 sales, $240 to $385 | $23421 sales, $198 to $325 | −37.4% | Fanatics Collect |
| Charizard (Japanese)Scarlet & Violet (SV2a) #185/165 · CGC Pristine 10 | $86.166 sales, $65.70 to $90 | $546 sales, $50.40 to $62.40 | −37.3% | Fanatics Collect |
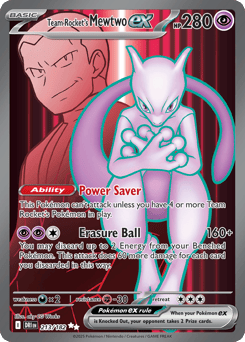 Team Rocket's Mewtwo exDestined Rivals #213 · CGC 10 | $60.996 sales, $45 to $80 | $38.4026 sales, $30 to $82 | −37.0% | Fanatics Collect |
 Mega Dragalge exChaos Rising #118 · CGC 10 | $626 sales, $41 to $84 | $4039 sales, $22 to $64.80 | −35.5% | Fanatics Collect |
Does it matter when the sales happened?
Matching sales within one 30-day period moves the like-for-like median from 97.9% to 95.1%, so timing does not change the picture much.
- 21.5 days
- Median distance apart
- between the middle dates of a card’s eBay and house auctions
- 766 of 2,443
- Cards more than 30 days apart
- 95.1%
- Same-period median
- 1,623 card-periods
How the periods were set
A card’s eBay sales and its house sales need not fall in the same weeks, and a price can move in between. To check, the window is cut into three consecutive periods of about 30 days and a card is compared only inside one period, with at least 3 sales on each side in it.
| Period | Cards | House vs eBay auctions | House higher | vs all eBay sales |
|---|---|---|---|---|
| Jul 15, 2026 to Aug 13, 2026 | 352 | 94.9% | 33.2% | 86.9% |
| Aug 14, 2026 to Sep 12, 2026 | 462 | 93.8% | 27.5% | 86.3% |
| Sep 13, 2026 to Oct 14, 2026 | 809 | 96.0% | 36.2% | 88.9% |
| All three, a card counted once per period | 1,623 | 95.1% | 33.1% | 87.5% |
- Timing moves the median from 97.9% for the whole window to 95.1% when sales are matched within a period, 2.8 points. The three periods read 94.9%, 93.8% and 96.0%.
- The house stays a little below eBay’s auctions on every cut.
- The share of cards where the house was higher falls from 43.7% to 33.1%.
- The same-period figures hold fewer cards because a card needs enough sales on both sides inside the one period.
Do other ways of cutting the data, and ungraded cards, change the answer?
Other cuts of the graded cards read 99.4% (every house sale), 98.0% (matching printing year) and 98.1% (without Fanatics), against 97.9% for the headline.
- Every sale at the houses (auctions, Fanatics buy-now listings that sold at a known price, and Alt’s fixed prices and accepted offers) against eBay auctions: 99.4% across 2,687 cards.
- Only the 2,289 cards whose eBay and house titles name the same printing year: 98.0%.
- Leaving out Fanatics, so only Goldin and Alt: 98.1% across 468 cards.
| Cut | Cards | eBay / house sales | House vs eBay (median) | Middle half | House higher |
|---|---|---|---|---|---|
| House auctions against eBay auctions, price paid (the headline) | 2,443 | 39,087 / 32,767 | 97.9% | 87.8% to 111.1% | 43.7% |
| House auctions against eBay fixed-price sales, price paid | 2,200 | 32,659 / 24,124 | 81.2% | 70.3% to 90.6% | 12.1% |
| House auctions against every eBay sale whatever its format, price paid | 4,059 | 98,642 / 48,359 | 86.4% | 73.0% to 98.2% | 22.7% |
| The same, on the headline's own cards | 2,443 | 88,800 / 32,767 | 89.4% | 79.8% to 99.7% | 24.1% |
| House hammer, before the buyer's premium, against eBay auctions | 2,280 | 37,561 / 29,888 | 80.1% | 72.2% to 90.9% | 14.7% |
| House hammer against every eBay sale | 3,803 | 94,107 / 44,340 | 70.5% | 59.8% to 80.5% | 9.5% |
| Every sale at the houses (auctions, fixed prices, accepted offers) against eBay auctions | 2,687 | 41,323 / 36,096 | 99.4% | 89.6% to 112.5% | 47.7% |
| Headline, only cards whose eBay and house titles name the same printing year | 2,289 | 38,061 / 30,732 | 98.0% | 88.2% to 111.1% | 44.0% |
| Headline with Goldin and Alt only | 468 | 18,852 / 2,601 | 98.1% | 91.8% to 107.9% | 44.2% |
Ungraded cards are reported apart, because the ledger records no condition for them and a raw copy can be near mint or worn.
- 120.0%
- Ungraded, Fanatics vs eBay auctions
- 85 cards, interval 106.2% to 147.3%
- 107.1%
- Ungraded, vs every eBay sale
- 90 cards
- 2,235 vs 901,986
- Ungraded copies sold
- houses against eBay
Reading the ungraded result
The houses sold only 2,235 ungraded copies in the window against 901,986 on eBay, and only Fanatics Collect has enough to compare.
Read it as a different result from the graded one, but not as a clean one: if the copies that go to auction are in better condition than those sold on eBay, that alone would lift the ratio.
How many sales does each venue contribute?
Fanatics Collect supplies 95.0% of the 147,212 house sales with a known price.
The sales behind these figures are those in UltraBall’s sold ledger for Jul 15, 2026 to Oct 14, 2026.
| Venue | Sales | Amount known | Amount unknown | Graded, known | Ungraded, known | Stated as auction, known |
|---|---|---|---|---|---|---|
 eBay | 1,465,406 | 1,196,550 | 268,856 | 294,052 | 901,986 | 297,826 |
| Fanatics Collect | 139,836 | 139,836 | 0 | 137,463 | 2,235 | 134,257 |
| Goldin | 564 | 564 | 0 | 564 | 0 | 564 |
| Alt | 6,812 | 6,812 | 0 | 6,812 | 0 | 6,592 |
How sales were counted, and coverage across the window
A sale of unknown amount counts as a sale and never goes into a price: an eBay listing that took an offer without saying for how much. A Fanatics buy-now listing with no known outcome is dropped altogether, as it may be a listing still open.
For eBay the last column counts only sales whose feed states an auction (125,036 known-price eBay sales state no format and are in no auction or fixed-price count).
Coverage is not even across the window. eBay’s pace was about 10,919 known-amount sales a day from Jul 15, 2026 to Jul 31, 2026, 8,940 a day from Aug 16, 2026 to Aug 31, 2026 and 14,611 a day from Sep 1, 2026.
Alt’s sales start on Jul 19, 2026, and Scrydex, one of the four feeds behind the eBay figures, stops on Sep 30, 2026. Goldin’s 564 sales run from Jul 20, 2026 to Oct 12, 2026 and are thin by any measure.
How this was worked out, and its limits
Data. UltraBall’s sold ledger, Pokémon cards sold Jul 15, 2026 to Oct 14, 2026: eBay (four feeds, one sale per listing), Fanatics Collect, Goldin and Alt. A lot of several cards is not a sale of one card and is dropped.
Prices are what the buyer paid: the eBay item price; at Fanatics Collect the weekly-auction hammer times 1.2 (other Fanatics lots are recorded at the buyer’s price); at Goldin the hammer times 1.22; at Alt the price Alt reports. Postage is in none of them.
eBay’s sale format. Two of the eBay feeds (trawl and SoldComps) record how an item sold; the other two (Scrydex and eBay’s own feed) do not. A listing is an auction, a fixed-price sale or an accepted offer when a feed says so, “conflict” when two feeds disagree, and “unknown” when none says.
The loader’s own format label is not used for eBay, because it calls any row with no format an auction.
Groups. A group is one card id, grade, printing (1st Edition, Shadowless, Reverse Holo or none) and language. A grade is the slab as sold, so CGC Pristine 10 and BGS Black Label are their own grades.
A group enters with at least 3 known-paid sales on each side: 20,759 of 143,656 graded and ungraded groups had a sale on both sides, and 2,443 graded groups had enough against eBay auctions. The house side is the houses’ auction sales.
Statistics. The ratio of a group is its house median over its eBay median. The headline is the median across groups. The interval is a 95% bootstrap over groups with 2,000 resamples and a fixed seed; it is shown only for ten or more groups.
“House higher” is the share of groups whose ratio is above 1. Price bands use the geometric mean of the two medians.
Printing check. Matching is by card id, which can join two printings that share a card number (a Celebrations reprint and the 2011 original). Each headline group is checked on the printing year its eBay titles and its house titles name.
2,289 groups agree, 11 differ, 67 have a side naming several years and 76 have a side naming none. All are in the statistics; the groups that differ or mix are never named in the tables or the graphic.
Limits. Only cards that sold at least three times each way are in the comparison, which leaves out the rarest. The ledger holds no condition for an ungraded copy and nothing for the centring or eye appeal of a graded one. Seller fees at every venue are not known and none is estimated.
The report cannot say whether the same copies would sell differently the other way round. The comparison describes past sales in this window, not advice. The full definitions are on the methodology page; the live record-sales data is on the record sales page.
Questions people ask
Do auction houses sell Pokémon cards for more or less than eBay?
In UltraBall’s analysis of 2,443 graded cards (15 July to 14 October 2026), the house price with the buyer’s premium was a median 97.9% of eBay’s auction price for the same card and grade, and higher for 43.7%. Each card needed at least 3 sales on each side; the 95% interval is 97.3% to 98.5%.
How do Fanatics Collect, Goldin and Alt prices compare with eBay?
In UltraBall’s 15 July to 14 October 2026 data, Fanatics Collect was a median 97.9% of eBay’s auction price over 2,053 cards and Alt 98.1% over 457. Goldin sold too little to read, with 5 cards, and Fanatics supplies 89.4% of the house sales behind the headline.
Do auction house prices include the buyer’s premium?
In UltraBall’s 15 July to 14 October 2026 data the like-for-like price includes the premium; at the hammer alone the house was a median 19.9% below eBay’s auction price across 2,280 cards, and 97.5% of it with the premium on the same cards. Seller fees are not known, so this says nothing about what sellers net.
Do Pokémon cards sell for more on eBay buy it now than at auction houses?
In UltraBall’s 15 July to 14 October 2026 data, the house median was 81.2% of eBay’s fixed-price sales across 2,200 cards, against 97.9% for eBay’s auctions. Pooling every eBay sale, 57.0% of them fixed price among sales with a known price, gives 86.4%.
Does the timing of sales change the auction house comparison?
Not much: in UltraBall’s 15 July to 14 October 2026 data, comparing a card only within one 30-day period gives a median 95.1% across 1,623 card-periods, against 97.9% for the whole window. A card’s eBay and house auctions fell a median 21.5 days apart.
The figures in this report are fixed as published. For the latest readings see the live data; every term is defined on the methodology page.