
UltraBall Research · Report · October 2026 edition
Where does the money go in the Pokémon card market? The priciest 1% of sales took 64% of the dollars
Of $198.6 million spent on 460,549 Pokémon card sales of known price in the 30 days to Oct 14, 2026, the priciest 1% of sales took 64% of the dollars and the top 1% of card-and-grade combinations took 56%.
Scope and full summary
Nearly half of sales were under $20 and added up to 0.86% of the money, and 209 cards took half the dollars. Without the 217 sales over $100,000, which are 24% of the dollars, the priciest 1% still took 54%.
Published · 460,549 sales of known price (English and Japanese cards), eBay, Fanatics Collect, Alt and Goldin, Sep 15 to Oct 14, 2026
This is the October 2026 edition of a study UltraBall reruns on fresh data, kept at this address with its figures fixed. The latest edition is always at ultraball.com/news/data/pokemon-card-market-concentration.
- $198.6 million
- Spent on Pokémon cards
- 460,549 sales, Sep 15, 2026 to Oct 14, 2026
- $20
- Median sale
- half of sales were below it
- 64%
- Dollars in the priciest 1% of sales
- 4,606 sales of $5,520+
- 56%
- Dollars in the top 1% of card-and-grade combinations
- 771 of 77,022
Key findings
In UltraBall’s analysis of 460,549 Pokémon card sales of known price from 15 September to 14 October 2026, the priciest 1% (4,606 sales of $5,520 or more) took 64% of the $198.6 million spent.
In UltraBall’s 15 September to 14 October 2026 data, sales over $100,000 are 24% of the dollars; without them the priciest 1% of sales still took 54%.
In UltraBall’s 15 September to 14 October 2026 data, the top 1% of card-and-grade combinations (771 of 77,022) took 56% of the dollars, 9 points fewer (47%) without Fanatics Collect.
In UltraBall’s 15 September to 14 October 2026 data, the top 1% of cards and printings took 55% of the dollars and the top 10% 95%; 209 cards (0.8% of those that sold) took half.
In UltraBall’s 15 September to 14 October 2026 data, 49.6% of sales were under $20, together 0.86% of the money. The 5,136 sales of $5,000 or more were 1.1% of sales and 66% of the dollars.
In UltraBall’s 15 September to 14 October 2026 data, graded cards were 34% of sales and 92% of dollars; raw cards were 66% of sales and 8% of dollars.
Cite this study
Free to quote and chart with a link to this page
UltraBall Research, ‘Where the money goes in the Pokémon card market’ (October 2026). https://ultraball.com/news/data/pokemon-card-market-concentration-october-2026
How much of the money do the priciest sales take? The top 1% took 64%
The top 1% took 64% of the money ranked by single sale, 56% by card-and-grade combination and 55% by card.
- 64%
- Priciest 1% of sales
- 4,606 sales of $5,520+
- 56%
- Top 1% of card-and-grade combinations
- 771 of 77,022
- 55%
- Top 1% of cards
- 266 of 26,571
UltraBall recorded 460,549 Pokémon card sales of known price between Sep 15, 2026 and Oct 14, 2026, for $198,633,828. The table ranks the same dollars three ways:
- by single sale (by price);
- by card (a card id and its printing, such as a 1st Edition, with every grade together);
- by card-and-grade combination (a card and printing in one grade, raw as its own grade).
| Ranking | Items | Share of dollars | English only |
|---|---|---|---|
| Priciest 1% of sales (by price) | 4,606 sales | 64.3% | 64.2% |
| Priciest 10% of sales (by price) | 46,055 sales | 90.2% | 90.1% |
| Top 1% of card-and-grade combinations | 771 combinations | 55.9% | 53.6% |
| Top 10% of card-and-grade combinations | 7,703 combinations | 91.2% | 90.4% |
| Top 1% of cards | 266 cards | 54.9% | 50.2% |
| Top 10% of cards | 2,658 cards | 94.6% | 93.0% |
The shares move with what is counted. In the four cuts below:
- the priciest 1% of sales took between 52% and 64%;
- the top 1% of card-and-grade combinations between 46% and 56%;
- the top 1% of cards between 46% and 55%.
The 217 sales over $100,000 are 24% of all dollars ($47,782,771), and Fanatics Collect is 43% of them.
| Counted | Dollars | Priciest 1% of sales | Top 1% of combinations | Top 1% of cards | Cards for half |
|---|---|---|---|---|---|
| All sales | $198.6 million | 64.3% | 55.9% | 54.9% | 209 |
| English cards only | $188.5 million | 64.2% | 53.6% | 50.2% | 185 |
| Without the sales over $100,000 | $150.9 million | 53.8% | 45.6% | 46.0% | 322 |
| Without Fanatics Collect | $113.8 million | 51.8% | 46.8% | 52.8% | 202 |
Smaller groups are just as top-heavy. Share of all dollars:
- 8.3%
- Top 10 cards
- 36.3%
- Top 100 cards
- 81.3%
- Top 1,000 cards
It takes 209 cards to reach half of all dollars, and 557 card-and-grade combinations.
What counts as a card
A card here is a card and its printing, so a 1st Edition and an Unlimited copy of the same card are two cards.
A top 1% by dollars is not a top 1% by popularity. The ranking above says where the money went, and a card can be there because a few sales were large. For how often cards sell, see the most-traded cards.
How much of the money is cheap sales? Nearly half of sales are under $20, and they are 0.86% of it
49.6% of sales were under $20, and together they were 0.86% of the dollars.
- $20
- Median sale
- half of sales were below it
- 49.6%
- Of sales under $20
- 228,434 sales
- 0.86%
- Of dollars from those sales
- $1,711,442
- 45.1%
- Of dollars from sales of $25,000 or more
- 1,124 sales, 0.24% of sales
- Under $521.5%99,074 sales
- $5 to $19.9928.1%129,360 sales
- $20 to $49.9916.7%76,799 sales
- $50 to $99.9910.5%48,410 sales
- $100 to $499.9915.1%69,618 sales
- $500 to $999.993.5%16,292 sales
- $1,000 to $4,999.993.4%15,860 sales
- $5,000 to $24,999.990.9%4,012 sales
- $25,000 and over0.2%1,124 sales
- Under $50.1%$251K
- $5 to $19.990.7%$1.5 million
- $20 to $49.991.3%$2.5 million
- $50 to $99.991.7%$3.4 million
- $100 to $499.997.9%$15.6 million
- $500 to $999.995.8%$11.5 million
- $1,000 to $4,999.9916.8%$33.3 million
- $5,000 to $24,999.9920.6%$41.0 million
- $25,000 and over45.1%$89.6 million
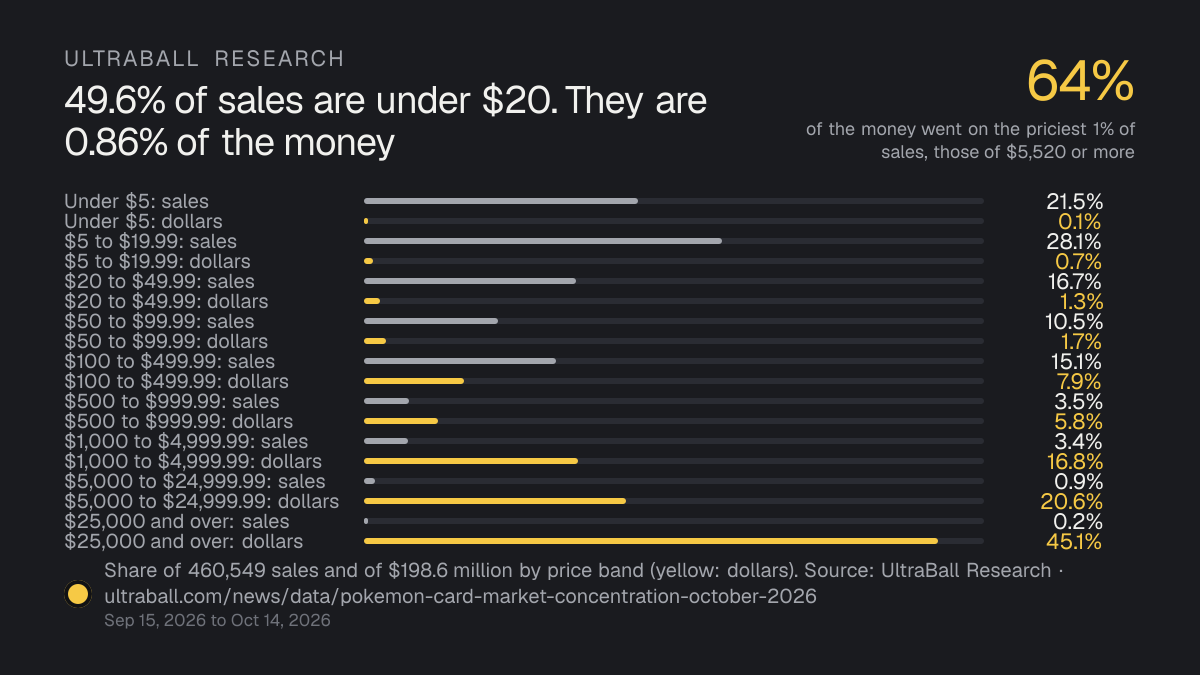
| Band | Sales | Share of sales | Dollars | Share of dollars |
|---|---|---|---|---|
| Under $5 | 99,074 | 21.5% | $251,292 | 0.1% |
| $5 to $19.99 | 129,360 | 28.1% | $1,460,150 | 0.7% |
| $20 to $49.99 | 76,799 | 16.7% | $2,489,897 | 1.3% |
| $50 to $99.99 | 48,410 | 10.5% | $3,442,976 | 1.7% |
| $100 to $499.99 | 69,618 | 15.1% | $15,606,737 | 7.9% |
| $500 to $999.99 | 16,292 | 3.5% | $11,482,420 | 5.8% |
| $1,000 to $4,999.99 | 15,860 | 3.4% | $33,349,013 | 16.8% |
| $5,000 to $24,999.99 | 4,012 | 0.9% | $40,961,725 | 20.6% |
| $25,000 and over | 1,124 | 0.2% | $89,589,619 | 45.1% |
The under-$5 band alone was 21.5% of sales (99,074) and 0.13% of dollars.
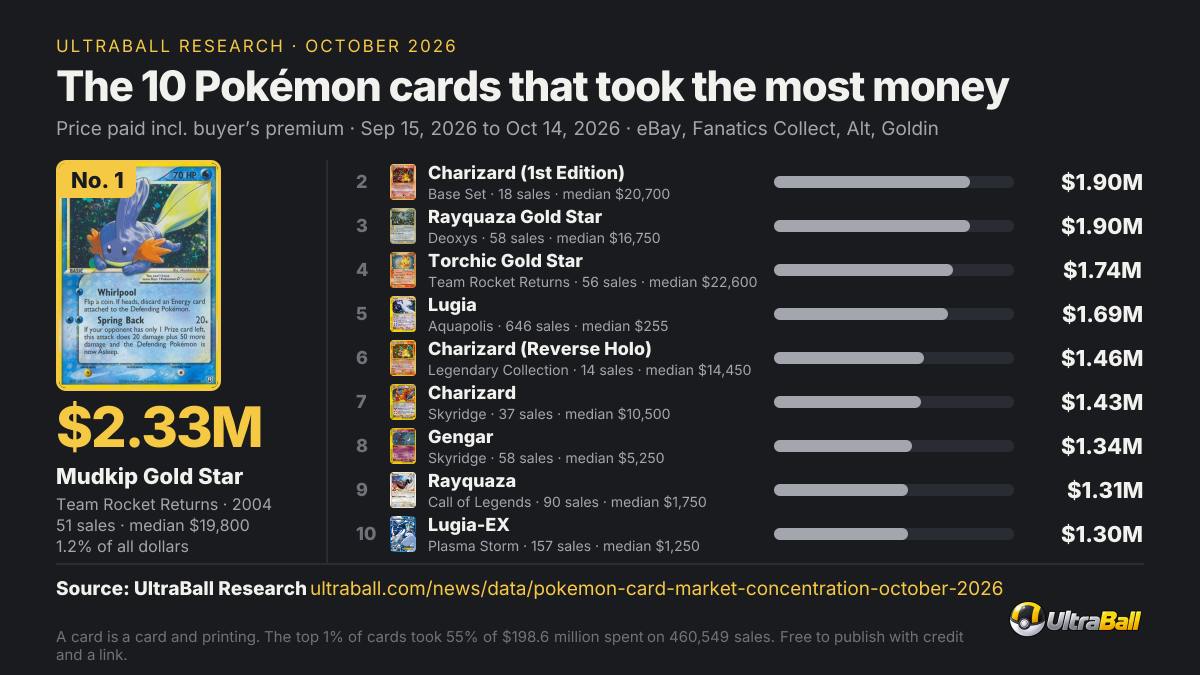
Which Pokémon cards took the most money? The top 20
These twenty cards took 13.8% of the dollars; the first ten took 8.2%.
The first ten are on the graphic below. A card is a card id and its printing, with every grade together: the 1st Edition Charizard is not the Unlimited one, and a reverse holo is not the holo.
All twenty are English cards.
The highest-ranked Japanese card is Rayquaza (Japanese), at number 74 with $444,000.
| # | Card | Dollars | Share | Sales | Median sale |
|---|---|---|---|---|---|
| 1 | 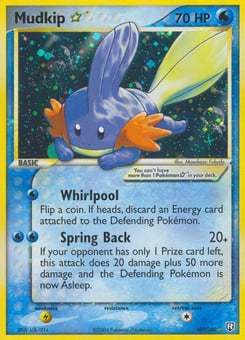 Mudkip ☆Team Rocket Returns · 2004 · most dollars in PSA 10 (44%) | $2,331,601 | 1.17% | 51 | $19,800 |
| 2 | 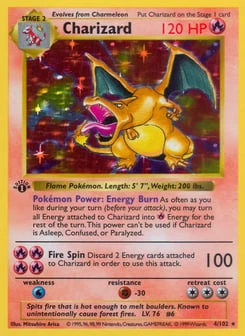 Charizard (1st Edition)Base Set · 1999 · most dollars in PSA 10 (73%) | $1,901,068 | 0.96% | 18 | $20,700 |
| 3 | 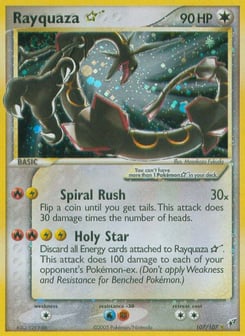 Rayquaza ☆Deoxys · 2005 · most dollars in PSA 9 (21%) | $1,899,592 | 0.96% | 58 | $16,750 |
| 4 | 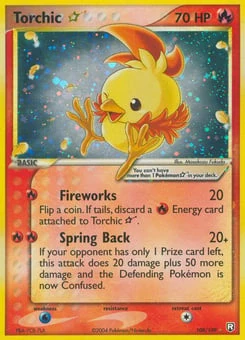 Torchic ☆Team Rocket Returns · 2004 · most dollars in PSA 9 (27%) | $1,737,289 | 0.87% | 56 | $22,600 |
| 5 | 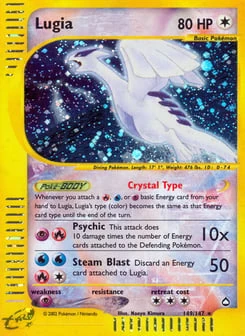 LugiaAquapolis · 2003 · most dollars in PSA 10 (41%) | $1,685,623 | 0.85% | 646 | $255 |
| 6 | 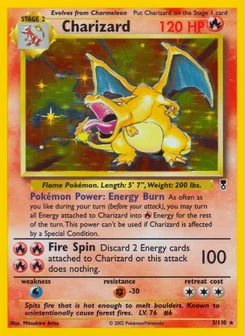 Charizard (Reverse Holo)Legendary Collection · 2002 · most dollars in PSA 10 (86%) | $1,460,884 | 0.74% | 14 | $14,450 |
| 7 | 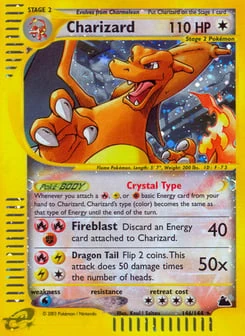 CharizardSkyridge · 2003 · most dollars in PSA 10 (69%) | $1,431,108 | 0.72% | 37 | $10,500 |
| 8 | 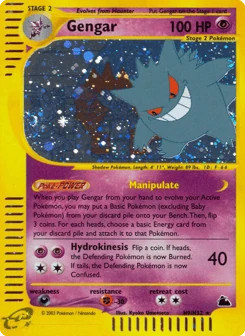 GengarSkyridge · 2003 · most dollars in PSA 10 (48%) | $1,338,215 | 0.67% | 58 | $5,250 |
| 9 | 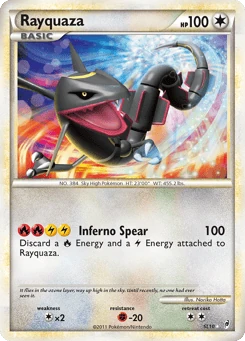 RayquazaCall of Legends · 2011 · most dollars in PSA 10 (61%) | $1,306,619 | 0.66% | 90 | $1,750 |
| 10 | 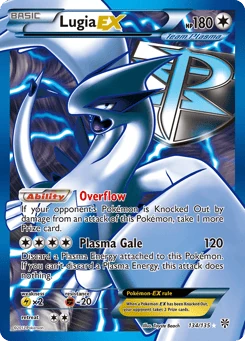 Lugia-EXPlasma Storm · 2013 · most dollars in PSA 10 (51%) | $1,299,994 | 0.65% | 157 | $1,250 |
| 11 | 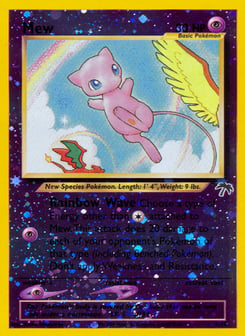 MewSouthern Islands · 2001 · most dollars in PSA 10 (65%) | $1,283,160 | 0.65% | 184 | $828 |
| 12 | 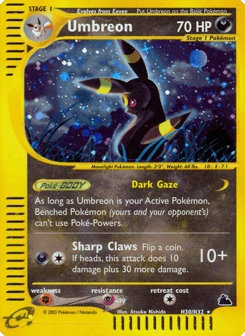 UmbreonSkyridge · 2003 · most dollars in PSA 10 (82%) | $1,189,002 | 0.60% | 42 | $5,373 |
| 13 | 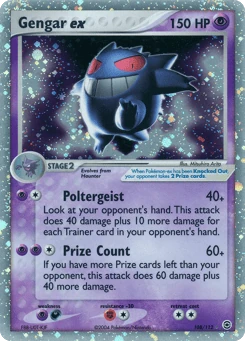 Gengar exFireRed & LeafGreen · 2004 · most dollars in PSA 10 (47%) | $1,134,982 | 0.57% | 143 | $2,750 |
| 14 | 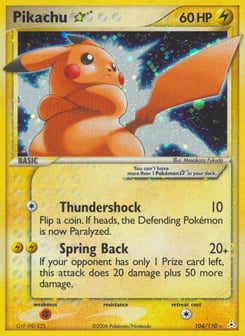 Pikachu ☆Holon Phantoms · 2006 · most dollars in PSA 10 (42%) | $1,131,468 | 0.57% | 59 | $8,700 |
| 15 | 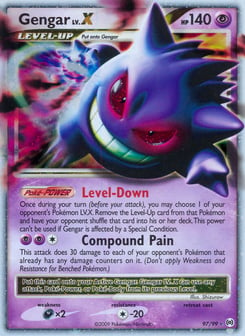 Gengar LV.XArceus · 2009 · most dollars in PSA 10 (72%) | $1,128,758 | 0.57% | 176 | $800 |
| 16 | 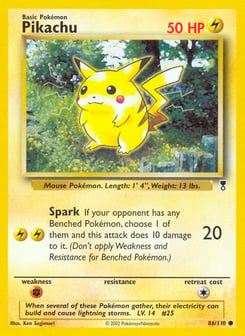 Pikachu (Reverse Holo)Legendary Collection · 2002 · most dollars in PSA 10 (72%) | $1,081,902 | 0.54% | 13 | $5,520 |
| 17 | 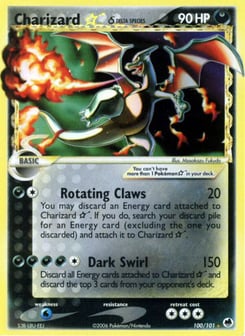 Charizard ☆ δDragon Frontiers · 2006 · most dollars in PSA 9 (21%) | $1,050,577 | 0.53% | 82 | $8,275 |
| 18 | 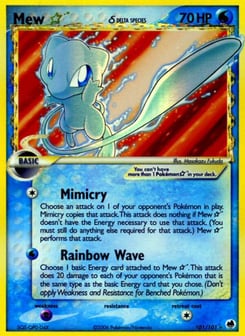 Mew ☆ δDragon Frontiers · 2006 · most dollars in PSA 10 (38%) | $1,025,336 | 0.52% | 94 | $4,375 |
| 19 | 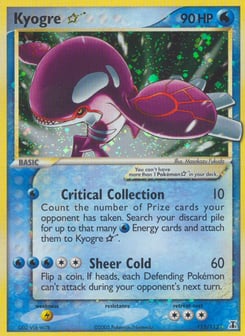 Kyogre ☆Delta Species · 2005 · most dollars in PSA 10 (78%) | $1,002,788 | 0.50% | 39 | $3,738 |
| 20 | 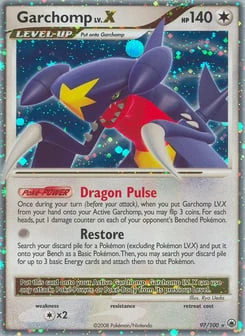 Garchomp LV.XMajestic Dawn · 2008 · most dollars in PSA 10 (91%) | $994,163 | 0.50% | 65 | $399 |
Download the top-ten graphic (PNG). The top 100 are in the CSV.
Which card and grade took the most money? By card and grade, all ten of the top combinations are PSA 10s
The combination with the most dollars was the Charizard (1st Edition) PSA 10, at $1,385,274 from 1 sale.
Splitting each card by grade gives 77,022 combinations with a sale. The top one is the Charizard (1st Edition) PSA 10, Base Set · 1999.
All ten combinations are PSA 10s.
| # | Card and grade | Dollars | Sales | Median sale |
|---|---|---|---|---|
| 1 | Charizard (1st Edition) PSA 10Base Set · 1999 | $1,385,274 | 1 | $1,385,274 |
| 2 | Charizard (Reverse Holo) PSA 10Legendary Collection · 2002 | $1,260,000 | 2 | $630,000 |
| 3 | Mudkip ☆ PSA 10Team Rocket Returns · 2004 | $1,020,000 | 1 | $1,020,000 |
| 4 | Charizard PSA 10Skyridge · 2003 | $982,000 | 5 | $189,999 |
| 5 | 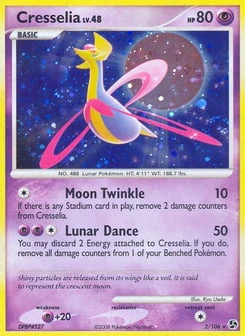 Cresselia PSA 10Great Encounters · 2008 | $981,300 | 4 | $7,650 |
| 6 | Umbreon PSA 10Skyridge · 2003 | $977,655 | 6 | $159,000 |
| 7 | Garchomp LV.X PSA 10Majestic Dawn · 2008 | $900,000 | 1 | $900,000 |
| 8 | Mew PSA 10Southern Islands · 2001 | $840,000 | 1 | $840,000 |
| 9 | Gengar LV.X PSA 10Arceus · 2009 | $816,892 | 4 | $210,000 |
| 10 | Rayquaza PSA 10Call of Legends · 2011 | $791,622 | 1 | $791,622 |
Which sets took the most Pokémon card money?
Legendary Collection took the most, $13,879,493 or 7.0% of dollars.
- 7.0%
- Legendary Collection
- $13,879,493
- 21.3%
- Top 5 sets
- 33.5%
- Top 10 sets
Of 386 sets with a sale, Legendary Collection took the most. The ten were printed between 1999 and 2011. The last column shows how much of a set’s dollars one card took.
| # | Set | Dollars | Share | Sales | Largest card’s share of set |
|---|---|---|---|---|---|
| 1 |  Legendary Collection2002 | $13,879,493 | 7.0% | 2,199 | 11% |
| 2 |  Skyridge2003 | $10,058,955 | 5.1% | 3,560 | 14% |
| 3 |  Team Rocket Returns2004 | $7,205,488 | 3.6% | 2,516 | 32% |
| 4 |  Aquapolis2003 | $5,927,458 | 3.0% | 3,950 | 28% |
| 5 |  Expedition Base Set2002 | $5,249,048 | 2.6% | 4,229 | 13% |
| 6 |  Holon Phantoms2006 | $5,137,303 | 2.6% | 2,435 | 22% |
| 7 |  Unseen Forces2005 | $4,949,118 | 2.5% | 2,701 | 19% |
| 8 |  Deoxys2005 | $4,931,956 | 2.5% | 1,923 | 39% |
| 9 |  Call of Legends2011 | $4,663,983 | 2.4% | 2,075 | 28% |
| 10 |  Base Set1999 | $4,568,018 | 2.3% | 11,940 | 42% |
| 11 |  Delta Species2005 | $4,067,342 | 2.1% | 2,708 | 25% |
| 12 |  Neo Destiny2002 | $3,790,051 | 1.9% | 3,326 | 12% |
| 13 |  Neo Revelation2001 | $3,637,504 | 1.8% | 2,281 | 17% |
| 14 |  Southern Islands2001 | $3,535,343 | 1.8% | 1,250 | 36% |
| 15 |  Dragon Frontiers2006 | $3,188,664 | 1.6% | 2,279 | 33% |
| 16 |  FireRed & LeafGreen2004 | $3,070,186 | 1.6% | 2,110 | 37% |
| 17 |  Majestic Dawn2008 | $2,756,457 | 1.4% | 1,189 | 36% |
| 18 |  Supreme Victors2009 | $2,708,702 | 1.4% | 1,654 | 28% |
| 19 |  Arceus2009 | $2,662,635 | 1.3% | 1,842 | 42% |
| 20 |  Neo Genesis2000 | $2,648,502 | 1.3% | 3,344 | 32% |
| 21 |  Crystal Guardians2006 | $2,620,269 | 1.3% | 2,370 | 20% |
| 22 |  Dragon2003 | $2,438,460 | 1.2% | 2,154 | 32% |
| 23 |  XY Black Star Promos2013 | $2,277,431 | 1.1% | 5,305 | 11% |
| 24 |  Ascended Heroes2026 | $2,263,035 | 1.1% | 16,503 | 24% |
| 25 |  Great Encounters2008 | $2,097,001 | 1.1% | 1,010 | 47% |
Which venues took the Pokémon card money?
Fanatics Collect had 9.6% of sales and 42.7% of dollars; eBay had 89.9% of sales and 47.9% of dollars.
- eBay: 89.9% of sales of known price and 47.9% of dollars, with a median sale of $19.99.
- Fanatics Collect: 9.6% of sales and 42.7% of dollars, with a median of $26.40.
- Those dollars come from a handful of days: four Mondays (Oct 12, 2026, Oct 5, 2026, Sep 28, 2026, Sep 21, 2026) took $79,977,425, 94% of Fanatics Collect’s dollars in the window, so its share is the weekly auctions’ share.
- Alt: 0.5% of sales and 9.1% of dollars (median $294).
- Goldin: 0.03% of sales and 0.31% of dollars (median $449); its coverage is thin.
| Venue | Sales | Share of sales | Dollars | Share of dollars | eBay sales of unknown price |
|---|---|---|---|---|---|
 eBay | 414,053 | 89.9% | $95,110,848 | 47.9% | 191,017 (31.6% of its sales) |
 Fanatics Collect | 44,255 | 9.6% | $84,810,953 | 42.7% | – |
 Alt | 2,117 | 0.5% | $18,099,988 | 9.1% | – |
 Goldin | 124 | 0.0% | $612,039 | 0.3% | – |
- eBay47.9%$95.1 million
- Fanatics Collect42.7%$84.8 million
- Alt9.1%$18.1 million
- Goldin0.3%$612K
Do graded cards take most of the money? They are 92% of it from 34% of sales
The median graded sale ($102) was 10 times the median raw sale ($10).
| Sales | Share of sales | Dollars | Share of dollars | Median sale | |
|---|---|---|---|---|---|
| Raw | 304,712 | 66.2% | $15,508,826 | 7.8% | $10 |
| Graded | 155,837 | 33.8% | $183,125,002 | 92.2% | $102 |
A raw card is one sold ungraded; every other grade, from PSA, CGC, Beckett or another company, is graded.
How much of the money went on English and Japanese cards?
Japanese cards were 9.4% of sales and 5.1% of dollars.
- Japanese cards: 43,338 sales and $10,167,421; their median sale was $16 against $21.04 for English cards.
- The English-only figures sit in the right-hand column of the first table.
- The shares are similar but not identical: the top 1% of English cards took 50.2% of English dollars, against 54.9% for both languages together, and 57.7% for Japanese cards on their own.
How this was worked out, and its limits
The sales. Every sale in UltraBall’s ledger from Sep 15, 2026 to Oct 14, 2026 (30 days) at eBay (four feeds of sold listings; Scrydex stops Sep 30, 2026), Fanatics Collect, Alt and Goldin. A sale reported by several feeds counts once, matched by its listing. Lots of several cards are left out. Each price is what the buyer paid, buyer’s premium included.
Sales of unknown price. 191,017 eBay sales (31.6% of eBay’s 605,070 sales in the window) are counted in no figure on this page: listings that took an offer without saying how much.
Fanatics Collect buy-now listings with no known outcome are dropped altogether, because they may still be open at their asking price and are not known to be sales.
Every share here is a share of sales of known price, so the real totals are higher than the ones shown, and the sales left out are of one kind (offers and buy-now listings), so the shares may not describe them.
Scope. English cards and Japanese cards (a Japanese card is one with its own Japanese id).
2,159 sales of printings in other languages (1,165 Japanese copies filed under English card ids, and Spanish, German, French, Italian, Korean, Chinese, Portuguese and Dutch copies; $416,341 in all) are left out of every figure. They are sales, but they are not that card’s sales.
Outliers. Following the six-figure report’s rule, a fixed-price or accepted-offer sale of $1,000 or more is not counted when it is over 10 times the highest auction of the same card, printing and grade from Jul 15, 2026 up to that day: an unconfirmed offer or a wrong listing has no competing bids to test it.
Where the grade has no auction to compare with, a sale of $50,000 or more is compared with the highest other sale of the same card and printing at any grade. Auctions are never left out.
183 sales worth $2,530,218 were left out under this rule, 16 of them of $50,000 or more (listed below); all 183 are in the CSV. The rule looks back only to Jul 15, 2026, so it can miss an outlier with no comparable sale since then.
| Sale | Price | Compared with |
|---|---|---|
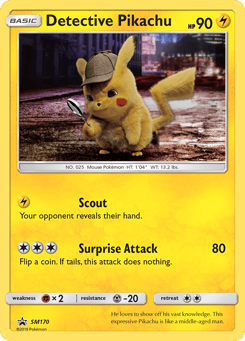 2019 POKEMON SM BLACK STAR PROMO #SM170 DETECTIVE PIKACHU-HOLO PSA 10PSA 10 · eBay · offer · Oct 9, 2026 | $420,000 | $172 (ACE 9, Oct 9, 2026), 2440.4× |
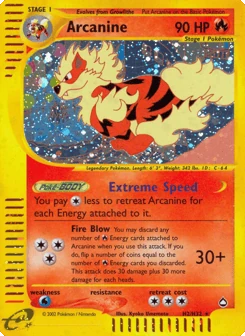 POKEMON ARCANINE AQUAPOLIS HOLO PSA 10 #H2 LOW POP 73 [SWIRL] RARE 💎🔥🌀PSA 10 · eBay · fixed price · Sep 27, 2026 | $200,000 | $12,688 (PSA 10, Aug 12, 2026), 15.8× |
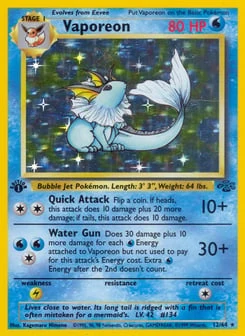 1999 Pokemon Jungle 1st Edition Holo Vaporeon #12PSA 10 · alt · offer · Oct 1, 2026 | $129,999 | $2,130 (CGC 10, Jul 27, 2026), 61× |
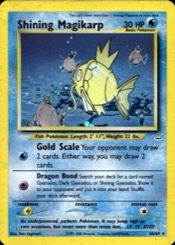 PSA 10 GEM MINT Shining Magikarp Holo Pokémon Neo Revelation 1.Edition 66/64PSA 10 · eBay · fixed price · Oct 6, 2026 | $119,999 | $168 (PSA 10, Aug 20, 2026), 716.4× |
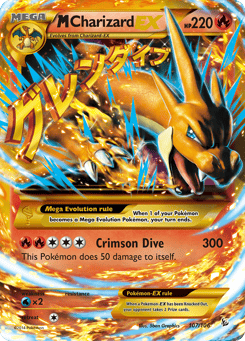 Pokemon PSA 10 M Charizard Ex #107 Holo XY Flashfire Ultra Rare 2014 EnglishPSA 10 · eBay · fixed price · Sep 24, 2026 | $112,152 | $854 (PSA 9, Aug 7, 2026), 131.3× |
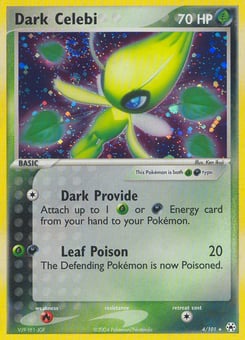 Pokemon 2004 EX Hidden Legends Dark Celebi 4/101 Holo Rare PSA 10 (POP 74)PSA 10 · eBay · fixed price · Oct 1, 2026 | $100,000 | $3,500 (PSA 10, Sep 10, 2026), 28.6× |
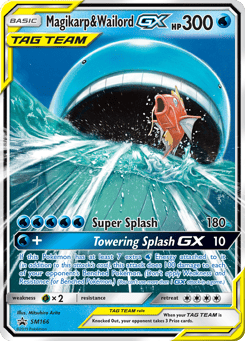 POP 10! Magikarp & Wailord GX Black Star Promo #SM166Raw · eBay · offer · Oct 12, 2026 | $87,500 | $610 (Raw, Jul 15, 2026), 143.4× |
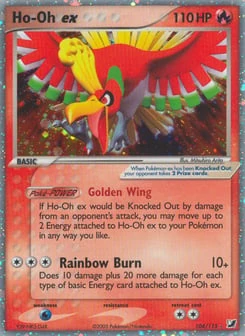 2005 POKEMON EX UNSEEN FORCES #104 HO-OH EX-HOLO UNSEEN FORCESRaw · eBay · fixed price · Sep 27, 2026 | $85,000 | $1,050 (Raw, Aug 17, 2026), 81× |
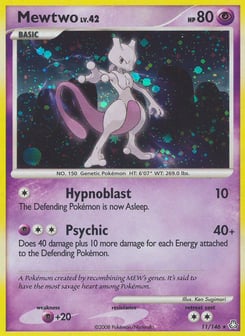 Pokemon Mewtwo Holo Legends Awakened 11/146 PSA 10 Gem MintPSA 10 · eBay · fixed price · Oct 7, 2026 | $80,000 | $3,250 (PSA 9, Sep 11, 2026), 24.6× |
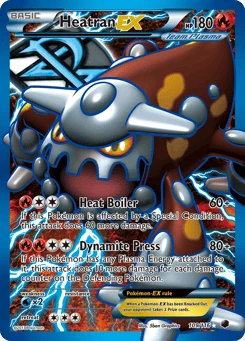 2013 Pokemon B & W #109 - Heatran EX Full Art - Plazma Freeze - GEM MINT PSA 10PSA 10 · eBay · fixed price · Oct 5, 2026 | $64,995 | $3,000 (PSA 9, Oct 4, 2026), 21.7× |
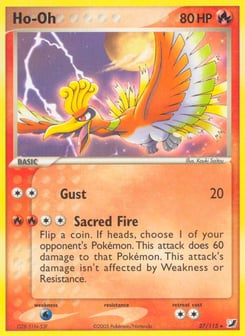 2005 POKEMON EX UNSEEN FORCES COSMOS #27 HO-OH-HOLO PSA 10PSA 10 · eBay · fixed price · Sep 22, 2026 | $60,000 | $1,000 (PSA 9, Sep 13, 2026), 60× |
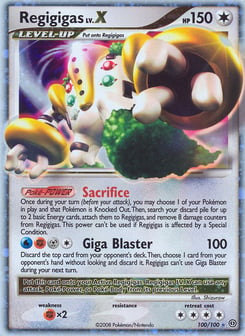 2008 Pokemon Diamond & Pearl Stormfront Holo Regigigas Lv.X #100 PSA 10 GEM MINTPSA 10 · fanatics · offer · Sep 21, 2026 | $55,579 | $450 (PSA 8, Aug 23, 2026), 123.5× |
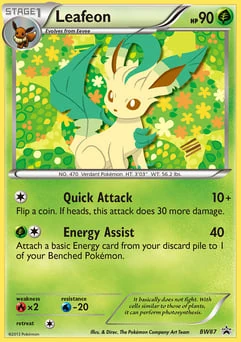 POKEMON BW BLACK STAR PROMO LEAFEON #BW87 HOLO FOIL PSA 10 GEM MINT #40771921PSA 10 · eBay · fixed price · Sep 20, 2026 | $55,000 | $1,020 (PSA 9, Sep 18, 2026), 53.9× |
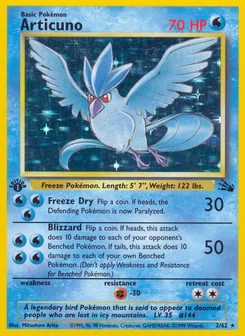 Articuno Fossil Cosmos Holo Test Print #2 PSA Authentic - Extremely RareRaw · eBay · fixed price · Oct 3, 2026 | $50,000 | $228 (Raw, Sep 10, 2026), 219.3× |
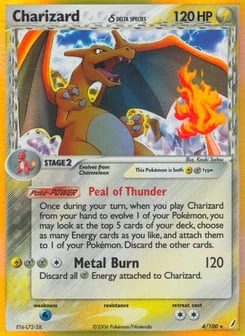 Pokémon 2006 EX Crystal Guardians Charizard #4 Holo PSA 10PSA 10 · eBay · fixed price · Sep 28, 2026 | $50,000 | $610 (PSA 10, Sep 9, 2026), 82× |
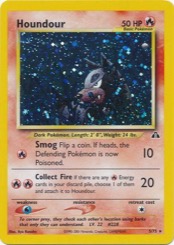 2001 POKEMON NEO DISCOVERY #5 HOUNDOUR-HOLO PSA 10PSA 10 · eBay · offer · Oct 3, 2026 | $50,000 | $1,200 (PSA 9, Sep 23, 2026), 41.7× |
Rankings. A card is a card id plus its printing (1st Edition, Shadowless, Reverse Holo, or the main printing), with every grade together. A card-and-grade combination is a card and printing plus the grade as sold, with raw as its own grade and a CGC Pristine 10 apart from a CGC 10.
“Top 1%” is the ceiling of 1% of the items ranked, by dollars for cards and combinations and by price for sales. A set is its set id, and the Japanese sets are separate from the English ones.
Coverage. eBay is 90% of the sales and its feeds run the whole window except Scrydex, which stops Sep 30, 2026. Alt’s sales begin in the data with Sep 15, 2026, Goldin’s are thin (124 sales) and there are no private sales.
A venue’s share is its share of what UltraBall can see, not of the whole market. The report describes Sep 15, 2026 to Oct 14, 2026 only, and says nothing about whether any card is a good buy. The most-traded page keeps updating; this report is fixed as of Oct 14, 2026.
Questions people ask
How much of the Pokémon card market do the most expensive sales take?
In UltraBall’s analysis of 460,549 sales from 15 September to 14 October 2026, the priciest 1% of sales took 64% of the $198.6 million spent. Sales over $100,000 are 24% of the dollars, and without them the priciest 1% still took 54%.
How many Pokémon cards make up half of the money?
In UltraBall’s 15 September to 14 October 2026 data, 209 cards (0.8% of the cards and printings that sold) took half of all dollars, and 557 card-and-grade combinations did the same. Without the sales over $100,000 it takes 322 cards.
How much money do cheap Pokémon card sales add up to?
49.6% of the sales UltraBall recorded from 15 September to 14 October 2026 were under $20, and together they were 0.86% of the money. The 5,136 sales of $5,000 or more were 1.1% of sales and 66% of the dollars.
Do graded cards take most of the money in Pokémon cards?
Yes. In UltraBall’s 15 September to 14 October 2026 data, graded cards were 34% of sales and 92% of dollars; raw cards were 66% of sales and 8% of dollars. Dollars cover sales of known price.
Which marketplaces take the most Pokémon card money?
In UltraBall’s 15 September to 14 October 2026 data, eBay had 90% of sales and 48% of dollars; Fanatics Collect had 10% of sales and 43% of dollars, 94% of it on four Mondays. Shares are of what UltraBall can see, not the whole market.
The figures in this report are fixed as published. For the latest readings see the live data; every term is defined on the methodology page.