
Vintage index
The most traded cards from the Wizards of the Coast era (1999 to 2003). One number for how their prices are moving, worked out every day from what they sell for.
Through Oct 7, 2026 · Aug 1, 2026 = 100
- Level
- 105.4
- +5.4 since Aug 1, 2026
- 1 day
- up +0.6%
- 7 days
- up +0.2%
- 30 days
- up +3.9%
- 90 days
- –
- Needs 90 days of daily prices
▲ +5.4% Aug 1, 2026 to Oct 7, 2026
Daily readings from Aug 1, 2026, when daily price tracking began. For the longer view, the monthly Vintage 100 and Modern 100 run from January 2022; they are a different measure and are not joined to this line.
Picked Oct 1, 2026
What’s in the Vintage index
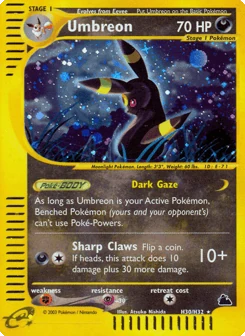
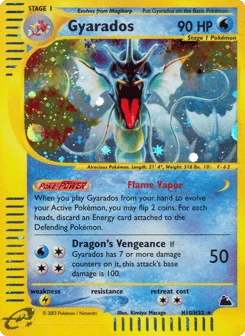
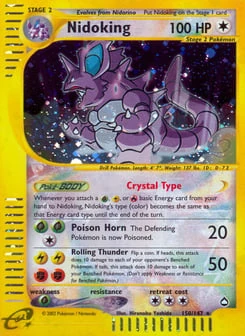
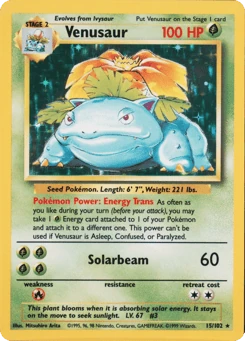
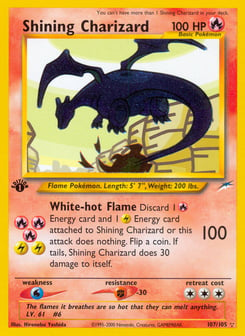
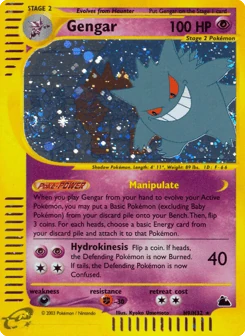
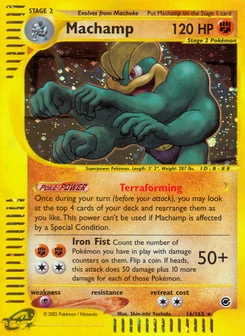
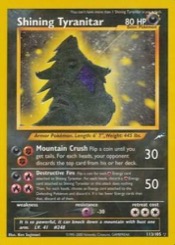
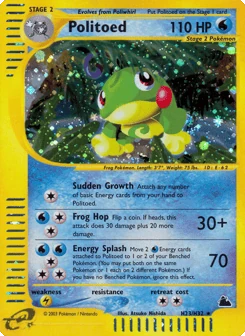
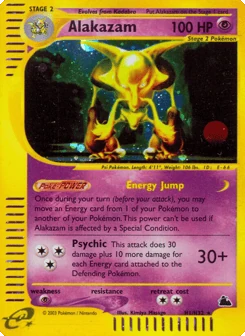
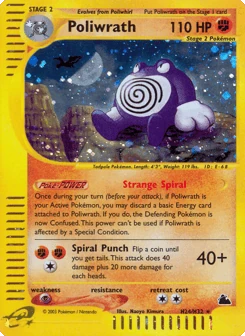
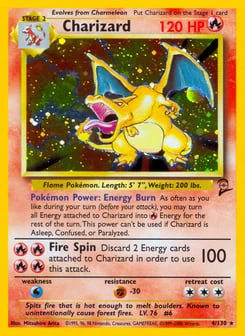
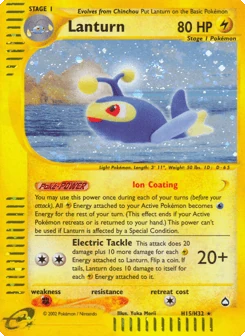
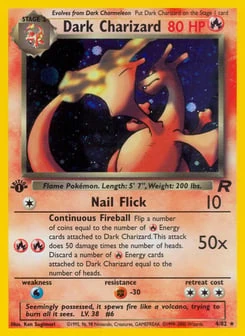
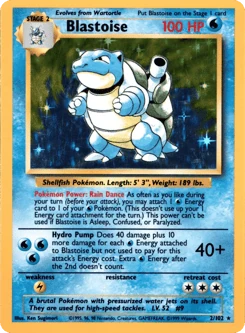
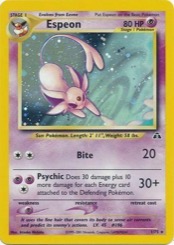
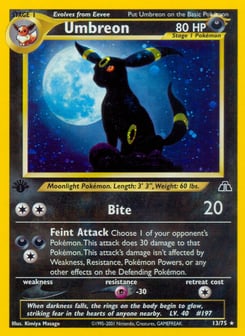
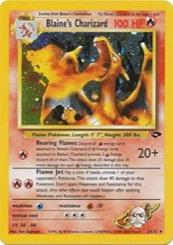
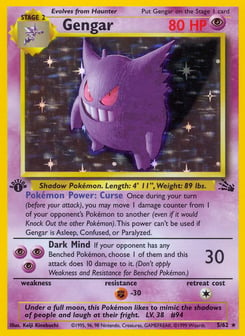
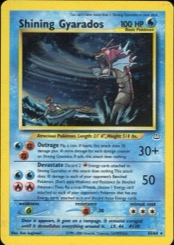
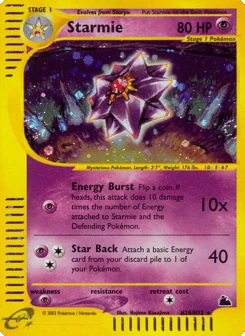
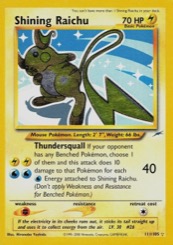
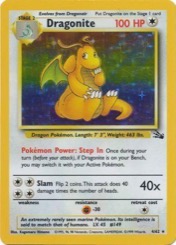
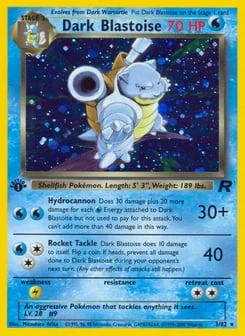
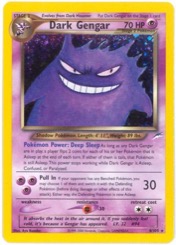
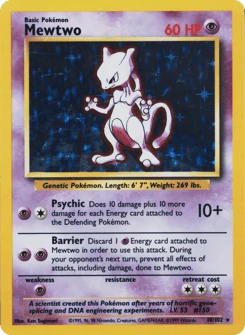
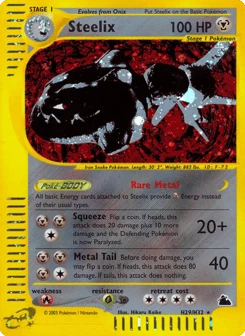
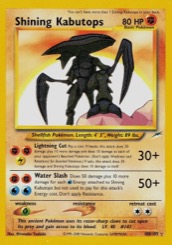
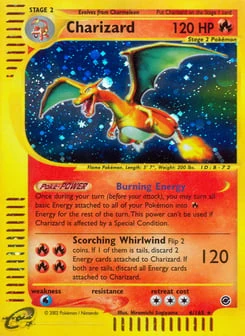
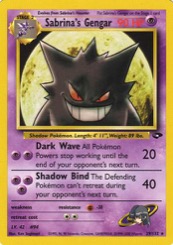
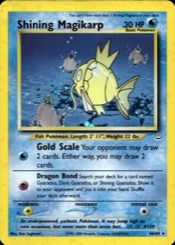
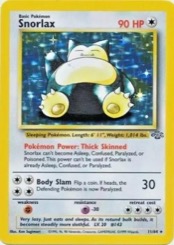
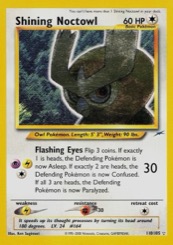
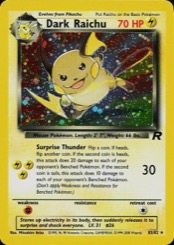
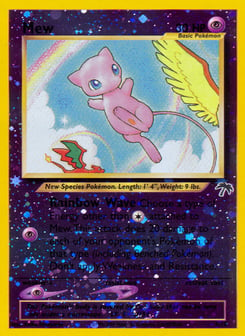
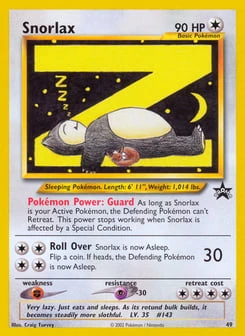
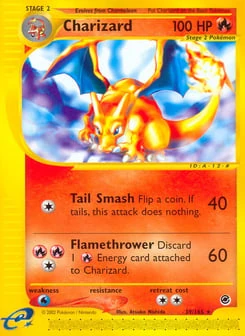
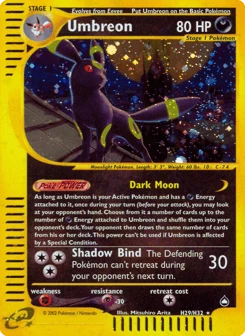
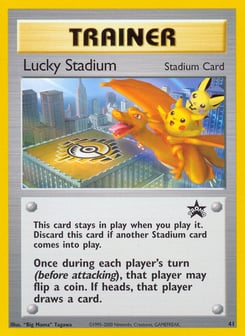
50 cards, heaviest first. Over the last 30 days 39 rose and 11 fell. A card’s weight follows how much money changes hands in it, and no card counts for more than 5%.





How this index is built
Which cards. A card is counted at one grade, ungraded or PSA 10. To qualify it needs at least 8 sales of that copy in 90 days, a price of $20 or more, a price that agrees with what it has actually sold for, and a price line steady enough to compare. The qualifying cards are ranked by the money that changes hands in them (price times sales) and the top 50 are taken.
When they change. The list is picked again on the first of each month, from the prices of that day. A card is never added for a rise that has already happened: it starts to count from the day it joins.
How much each counts. By the square root of its dollar volume, capped at 5%. A heavily traded card matters more, and no single card can be the index.
The daily move. The weighted average of each card’s price change that day. One card’s move counts to at most 15% in a day, and a price that sat unchanged for 10 days and then jumped is left out for that day: that is a late update, not a day’s trading. The level is chained from 100 on Aug 1, 2026 and shown as a 7-day average, like every price line on the site, so it trails the market by a few days and one repricing day never draws a cliff.
What it is not. It is a measure of prices, not a product, a forecast or advice. It covers English cards sold publicly, and it only goes back to when daily prices began.
Act on it
An index says where prices are heading. These pages show the cards you could buy today.
Daily
All market indexes
| Index | Last 30 readings | Level | 1 day | 7 days | 30 days |
|---|---|---|---|---|---|
| UltraBall 100100 cards | 99.1 | down −0.6% | down −2.7% | down −4.2% | |
| Vintage50 cards | 105.4 | up +0.6% | up +0.2% | up +3.9% | |
| Modern50 cards | 89.5 | down −1.6% | down −6.1% | down −11% | |
| PSA 10100 cards | 101.7 | down −0.4% | down −1.6% | down −2.1% | |
| Raw100 cards | 95.3 | down −0.9% | down −5.6% | down −6.1% | |
| Charizard50 cards | 96.6 | down −0.7% | down −3.3% | down −4.4% | |
| Pikachu50 cards | 102.0 | down −0.5% | down −2.8% | down −2.9% | |
| Eeveelutions50 cards | 101.1 | down −0.5% | down −3.0% | down −3.1% | |
| Sword & Shield50 cards | 94.5 | down −1.0% | down −4.9% | down −7.9% | |
| Scarlet & Violet50 cards | 89.8 | down −1.3% | down −6.3% | down −10% |